Electronic waste contains real, measurable value. Gold, silver, palladium, copper — these metals are present in virtually every device that gets processed, traded, or recycled. But understanding what a material is actually worth requires reading the data behind it, not relying on category averages or visual estimates.
This guide walks through every data point on a Recovert e-waste analysis page, using the Apple iPad as a real example.
What Is an E-Waste Analysis Page?
An e-waste analysis page on Recovert is a structured data entry for a specific electronic device or component. It contains everything needed to value that material — weight, metal composition, price per kilogram, unit value, recovery rate, and environmental impact.
Every entry is backed by certified laboratory analysis. The numbers are not estimates or category averages — they reflect the actual composition of that specific device.
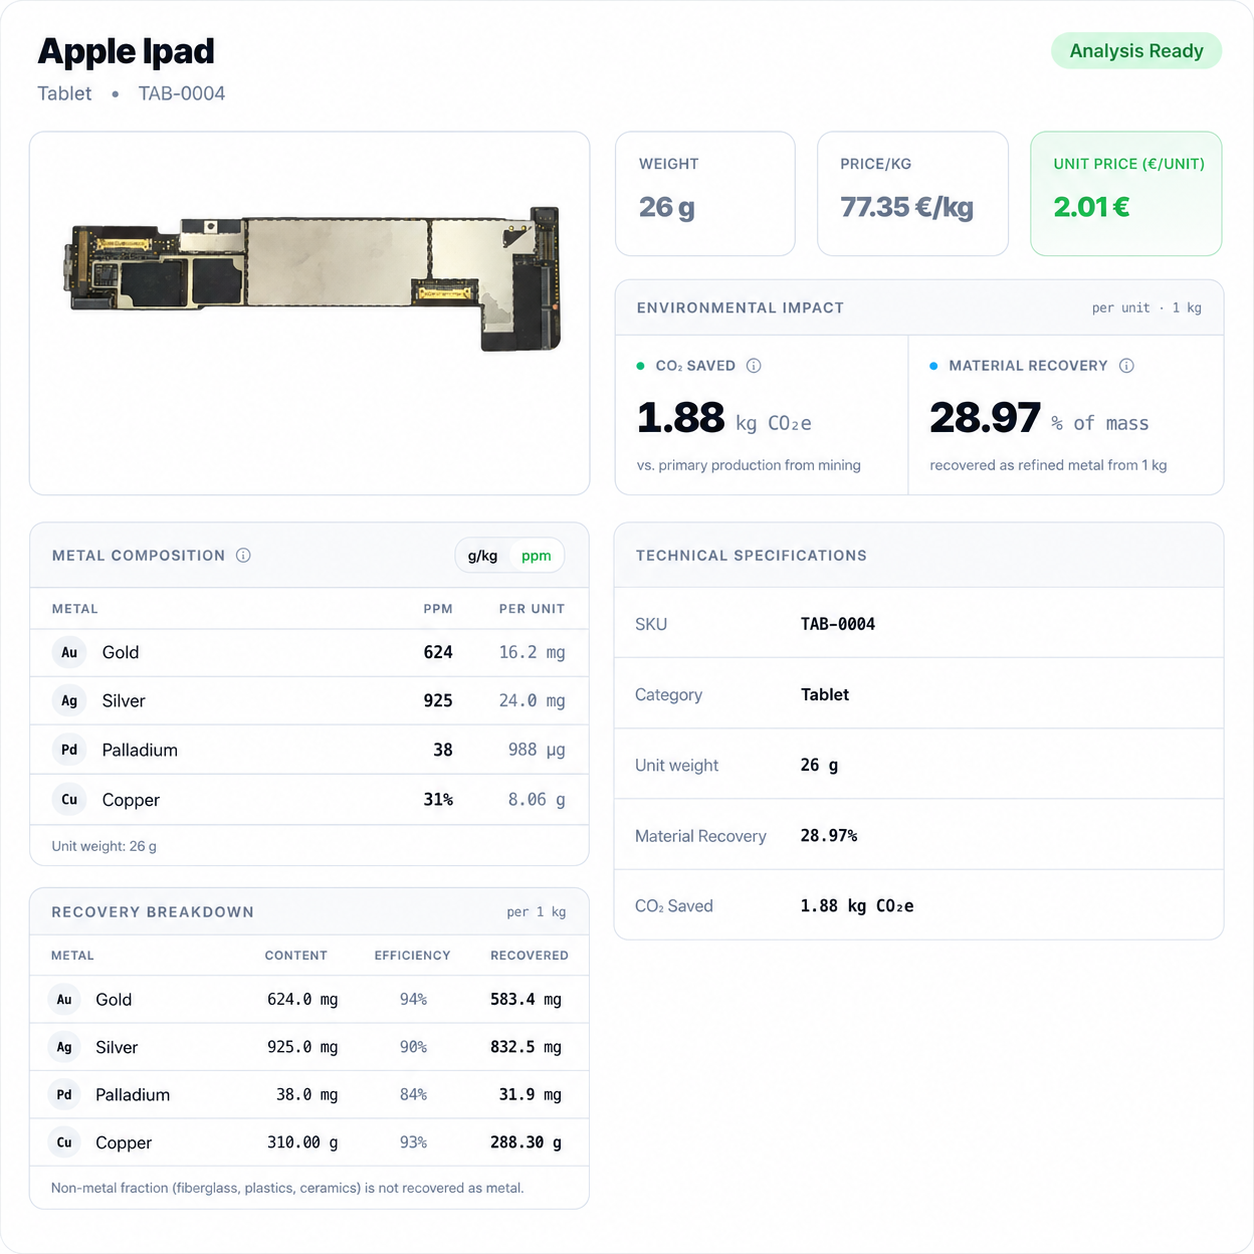
The Apple iPad entry (TAB-0004) is a tablet PCB weighing 26 grams per unit. Here is what each section of the analysis means.
Weight
Weight is the starting point for all valuation. The iPad PCB weighs 26 grams per unit. This figure is used to calculate how many units are in a given batch weight and to scale metal content from per-kilogram figures to per-unit figures.
When you enter a batch weight in the Recovert Calculator, the platform uses the unit weight to calculate the number of units in that batch automatically.
Price per Kilogram and Unit Price
The iPad PCB is valued at 77.35 €/kg, with a unit price of 2.01 € per device.
Price per kilogram is the primary trading reference — it reflects the certified metal composition of that specific device linked to current market prices for gold, silver, palladium, and copper. It is not an average market rate for tablets as a category. It is a calculated value based on what this specific board contains.
Unit price is simply price per kilogram multiplied by unit weight — useful when evaluating individual devices or small batches.
Price variation is tracked daily and monthly so you can see how market conditions are affecting valuation in real time.
Metal Composition — What Au, Ag, Pd, and Cu Mean
Metal composition is the core of the analysis. The iPad PCB contains four recoverable metals:
- Au — Gold. 624 ppm / 16.2 mg per unit. Gold is present in connectors, bonding wires, and contact surfaces. Even in small quantities, gold has a significant impact on price per kilogram because of its high market value.
- Ag — Silver. 925 ppm / 24.0 mg per unit. Silver is used in solder alloys, contacts, and thick-film circuits. It is typically present in higher quantities than gold.
- Pd — Palladium. 38 ppm / 988 μg per unit. Palladium is found in multilayer ceramic capacitors (MLCCs). It is present in smaller amounts but has a high market value per gram.
- Cu — Copper. 31% of total mass / 8.06 g per unit. Copper makes up the largest portion of recoverable material by weight — board layers, traces, and connectors. Its lower price per gram is offset by its high volume.
ppm vs g/kg — what is the difference?
Both units measure the same thing — metal concentration — in different scales. Parts per million (ppm) is the format used in laboratory analysis and trading contexts. Grams per kilogram (g/kg) is the same value expressed differently: 624 ppm equals 0.624 g/kg. Recovert displays both so you can work in whichever format matches your buyer or processor.
Recovery Rate — Not the Same as Composition
This is where many valuation mistakes happen.
Metal composition tells you what a material contains. Recovery rate tells you how much of that content can actually be extracted during processing. These are two different numbers.
The Apple iPad PCB has a material recovery rate of 28.97% of mass — meaning 28.97% of the total weight is recoverable as refined metal under real processing conditions.
The recovery breakdown shows exactly how this splits per metal:
- Gold: 624 mg content → 94% efficiency → 583.4 mg recovered
- Silver: 925 mg content → 90% efficiency → 832.5 mg recovered
- Palladium: 38 mg content → 84% efficiency → 31.9 mg recovered
- Copper: 310 g content → 93% efficiency → 288.3 g recovered
Recovery efficiency varies by metal and by device construction. A device with high gold content but low recovery efficiency delivers less actual yield than the composition figure suggests. At industrial volumes, the gap between theoretical content and recoverable yield determines whether a batch is profitable.
This is why recovery rate must be evaluated alongside composition — not separately.
CO₂ Saved
Recycling one Apple iPad PCB saves 1.88 kg of CO₂e compared to producing the same metals through primary mining. This figure is calculated by comparing the environmental impact of recycling with the emissions generated by extracting virgin raw materials.
This data supports ESG reporting and provides documented environmental impact per device — not per category. It can be aggregated across a full batch using the Recovert Calculator.
How to Use This Data Before Selling or Buying
The analysis page gives you a complete picture of a material before any transaction takes place. Before selling a batch, you can verify the composition and pricing of each device type, understand what recovery rate to expect from that material, calculate total batch value at your actual volume, and document the environmental impact for reporting purposes.
Before buying, you can compare composition data across device types in the same category, identify which materials deliver the highest value per kilogram at your processing conditions, and negotiate based on certified data rather than a buyer's estimate.
The Recovert mobile catalog covers smartphones, tablets, and other mobile devices — each with the same structured analysis.
Where to Start
If you process or trade electronic waste and want to base valuation on certified data rather than category averages, the Recovert catalog gives you analysis-ready entries across PCBs, payment terminals, tablets, smartphones, GPUs, RAM modules, and industrial electronics.